
The optimization backbone for upstream and downstream operations.
From well performance to crude blend, AOMs decide the optimal next move across upstream and refinery operations — closed-loop, constraint-bound, control-room ready.
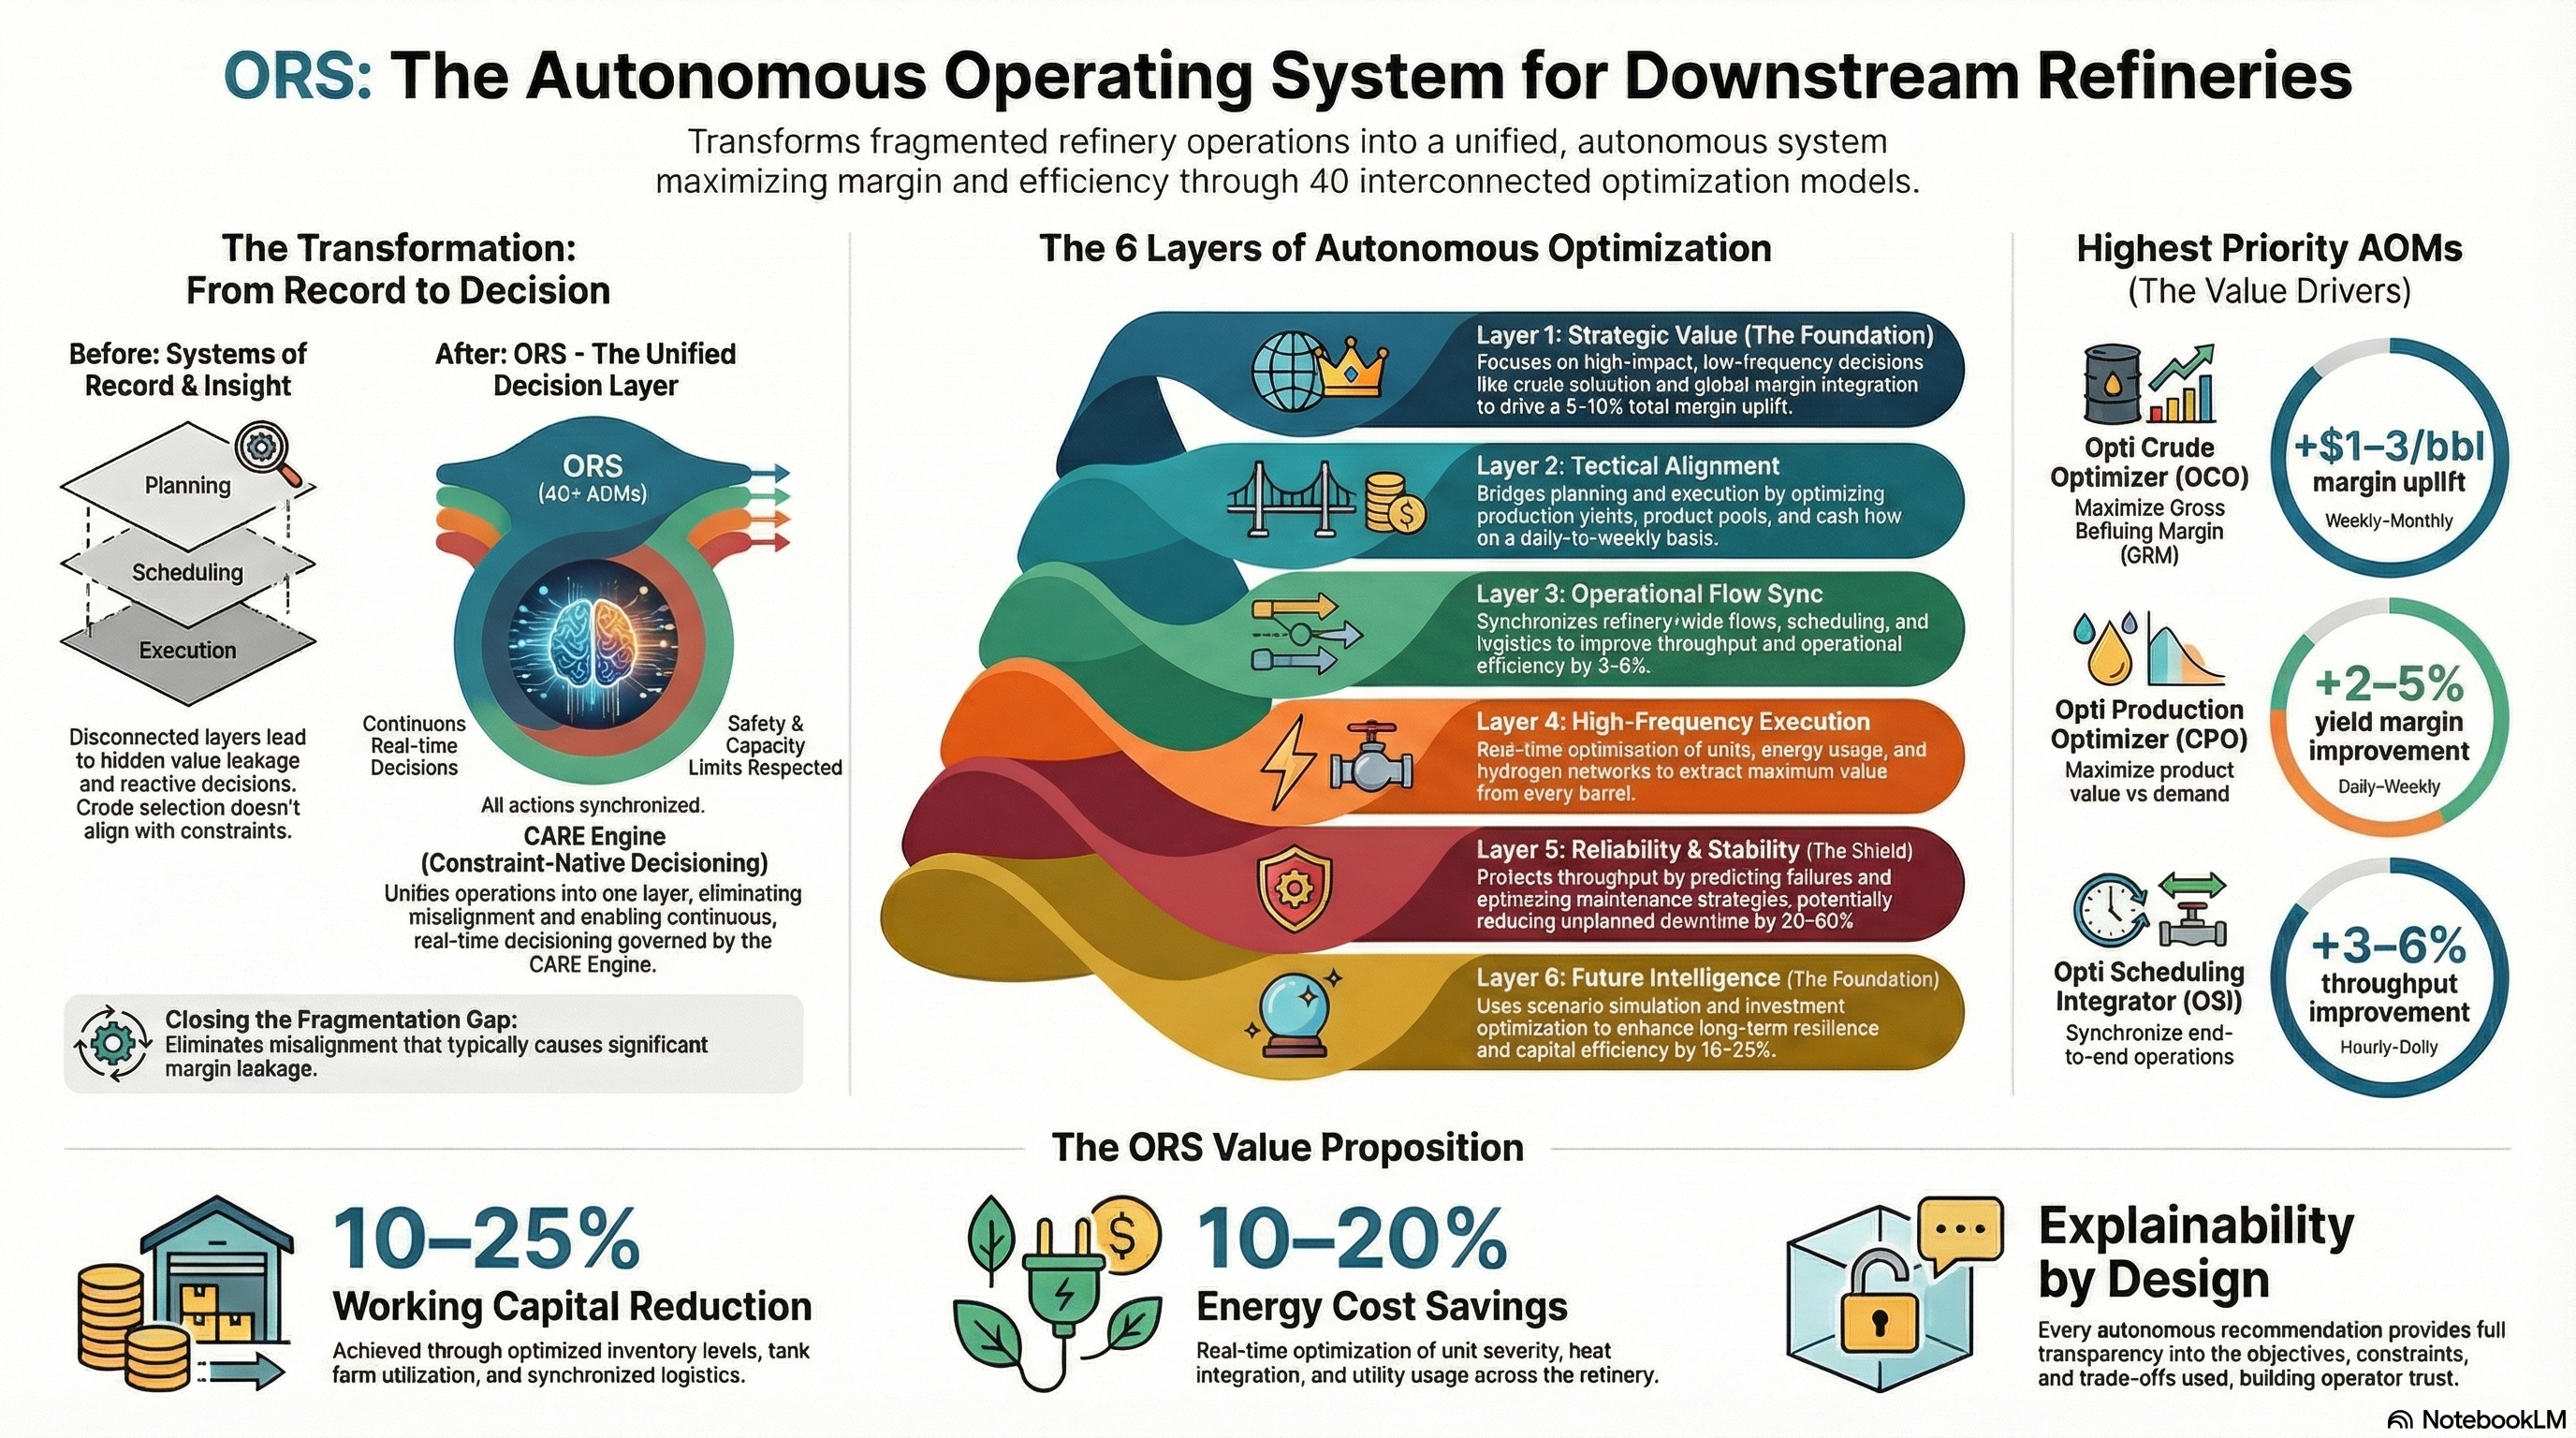
- GRM uplift +5–10%
- Throughput +3–6%
- Downtime −20–40%
- Working Capital −10–25%
What it solves, who it empowers, what it delivers.
The OptiEnergy Team exists for one reason: to take a stack of decisions that are too fast, too constrained, and too consequential for spreadsheets — and run them in a closed loop, every cadence, against your real numbers.
- Asset / Production ManagerRuns the field for NPV — not just volume.
- Production EngineerSets choke and lift against real reservoir signals.
- Field Operations LeadSequences crew tasks against routes, daylight, HSE.
- Reservoir EngineerRefits decline curves continuously, feeds plans downstream.
- Reliability EngineerIntervenes on wells that actually move the dial.
- Wells produce below economic potential — choke, lift, pad coordination drift on stale data.
- Deferment events are caught too late — root cause is cold by then.
- Workovers and interventions are sequenced on hunches, not NPV under rig availability.
- Field crew time leaks into the wrong wells in the wrong order.
- Allocation reconciliation across wells, pads, and meters eats engineering hours.
65 players. One sector team.
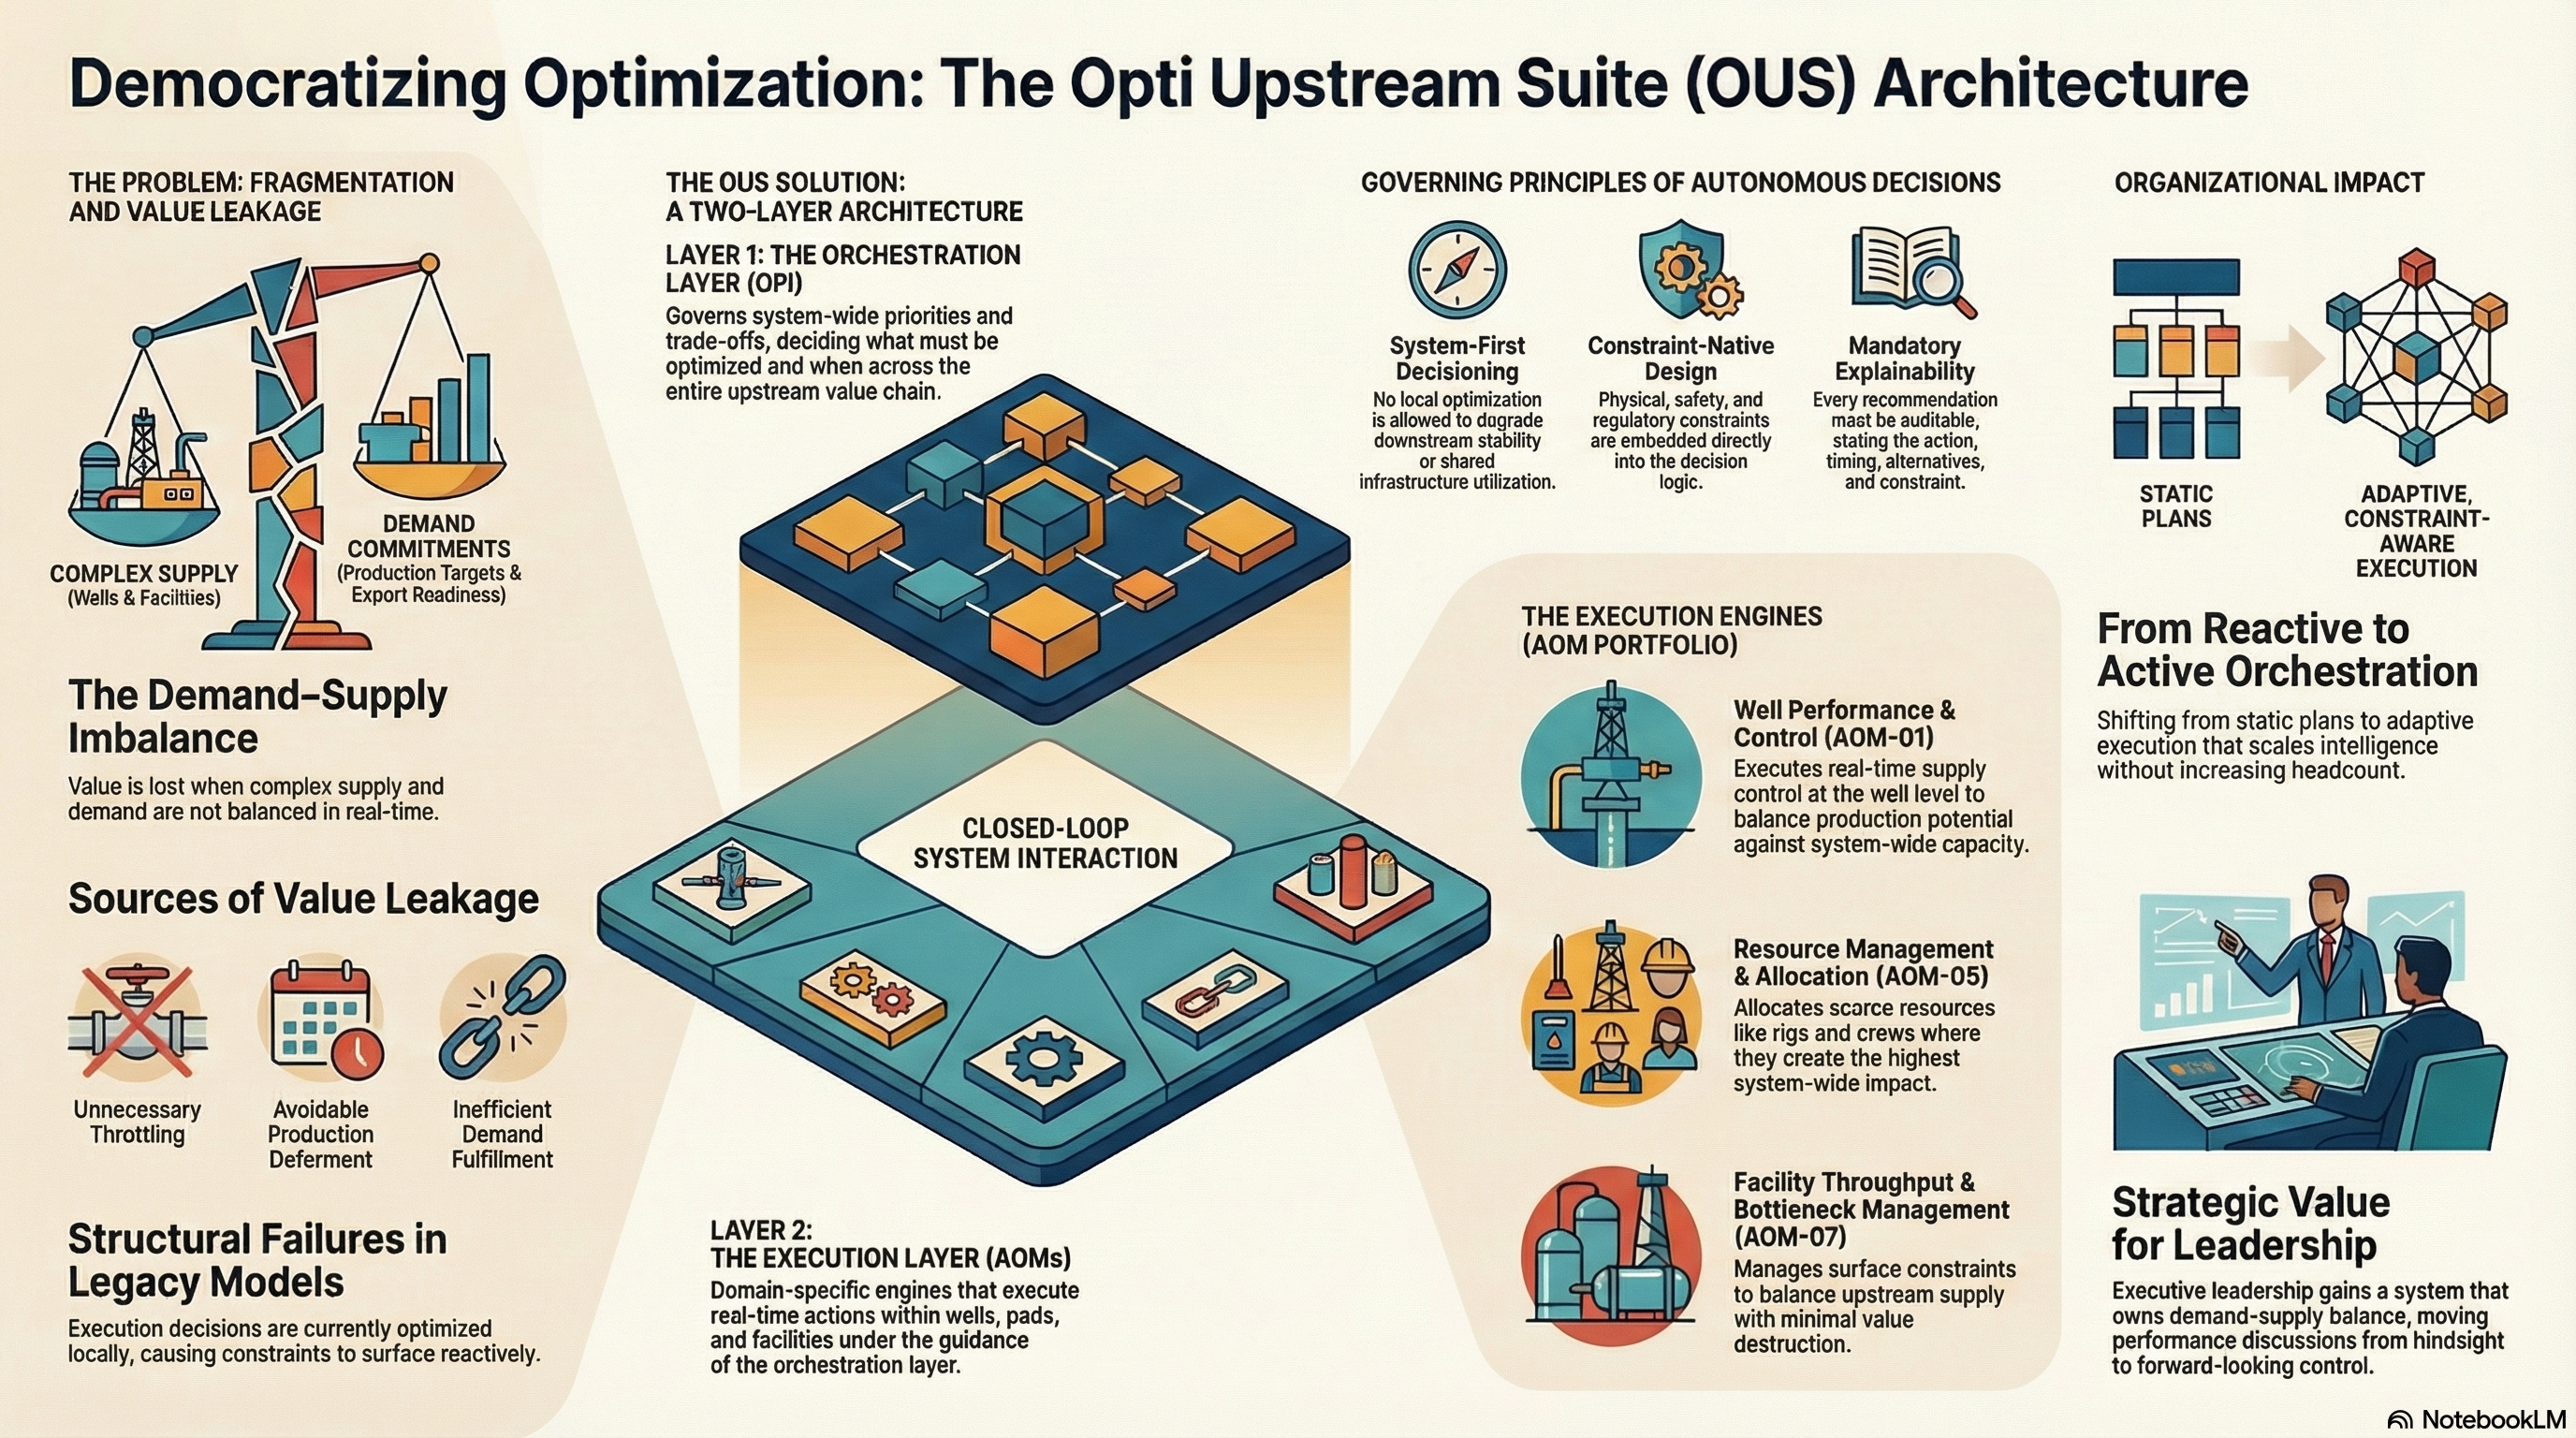
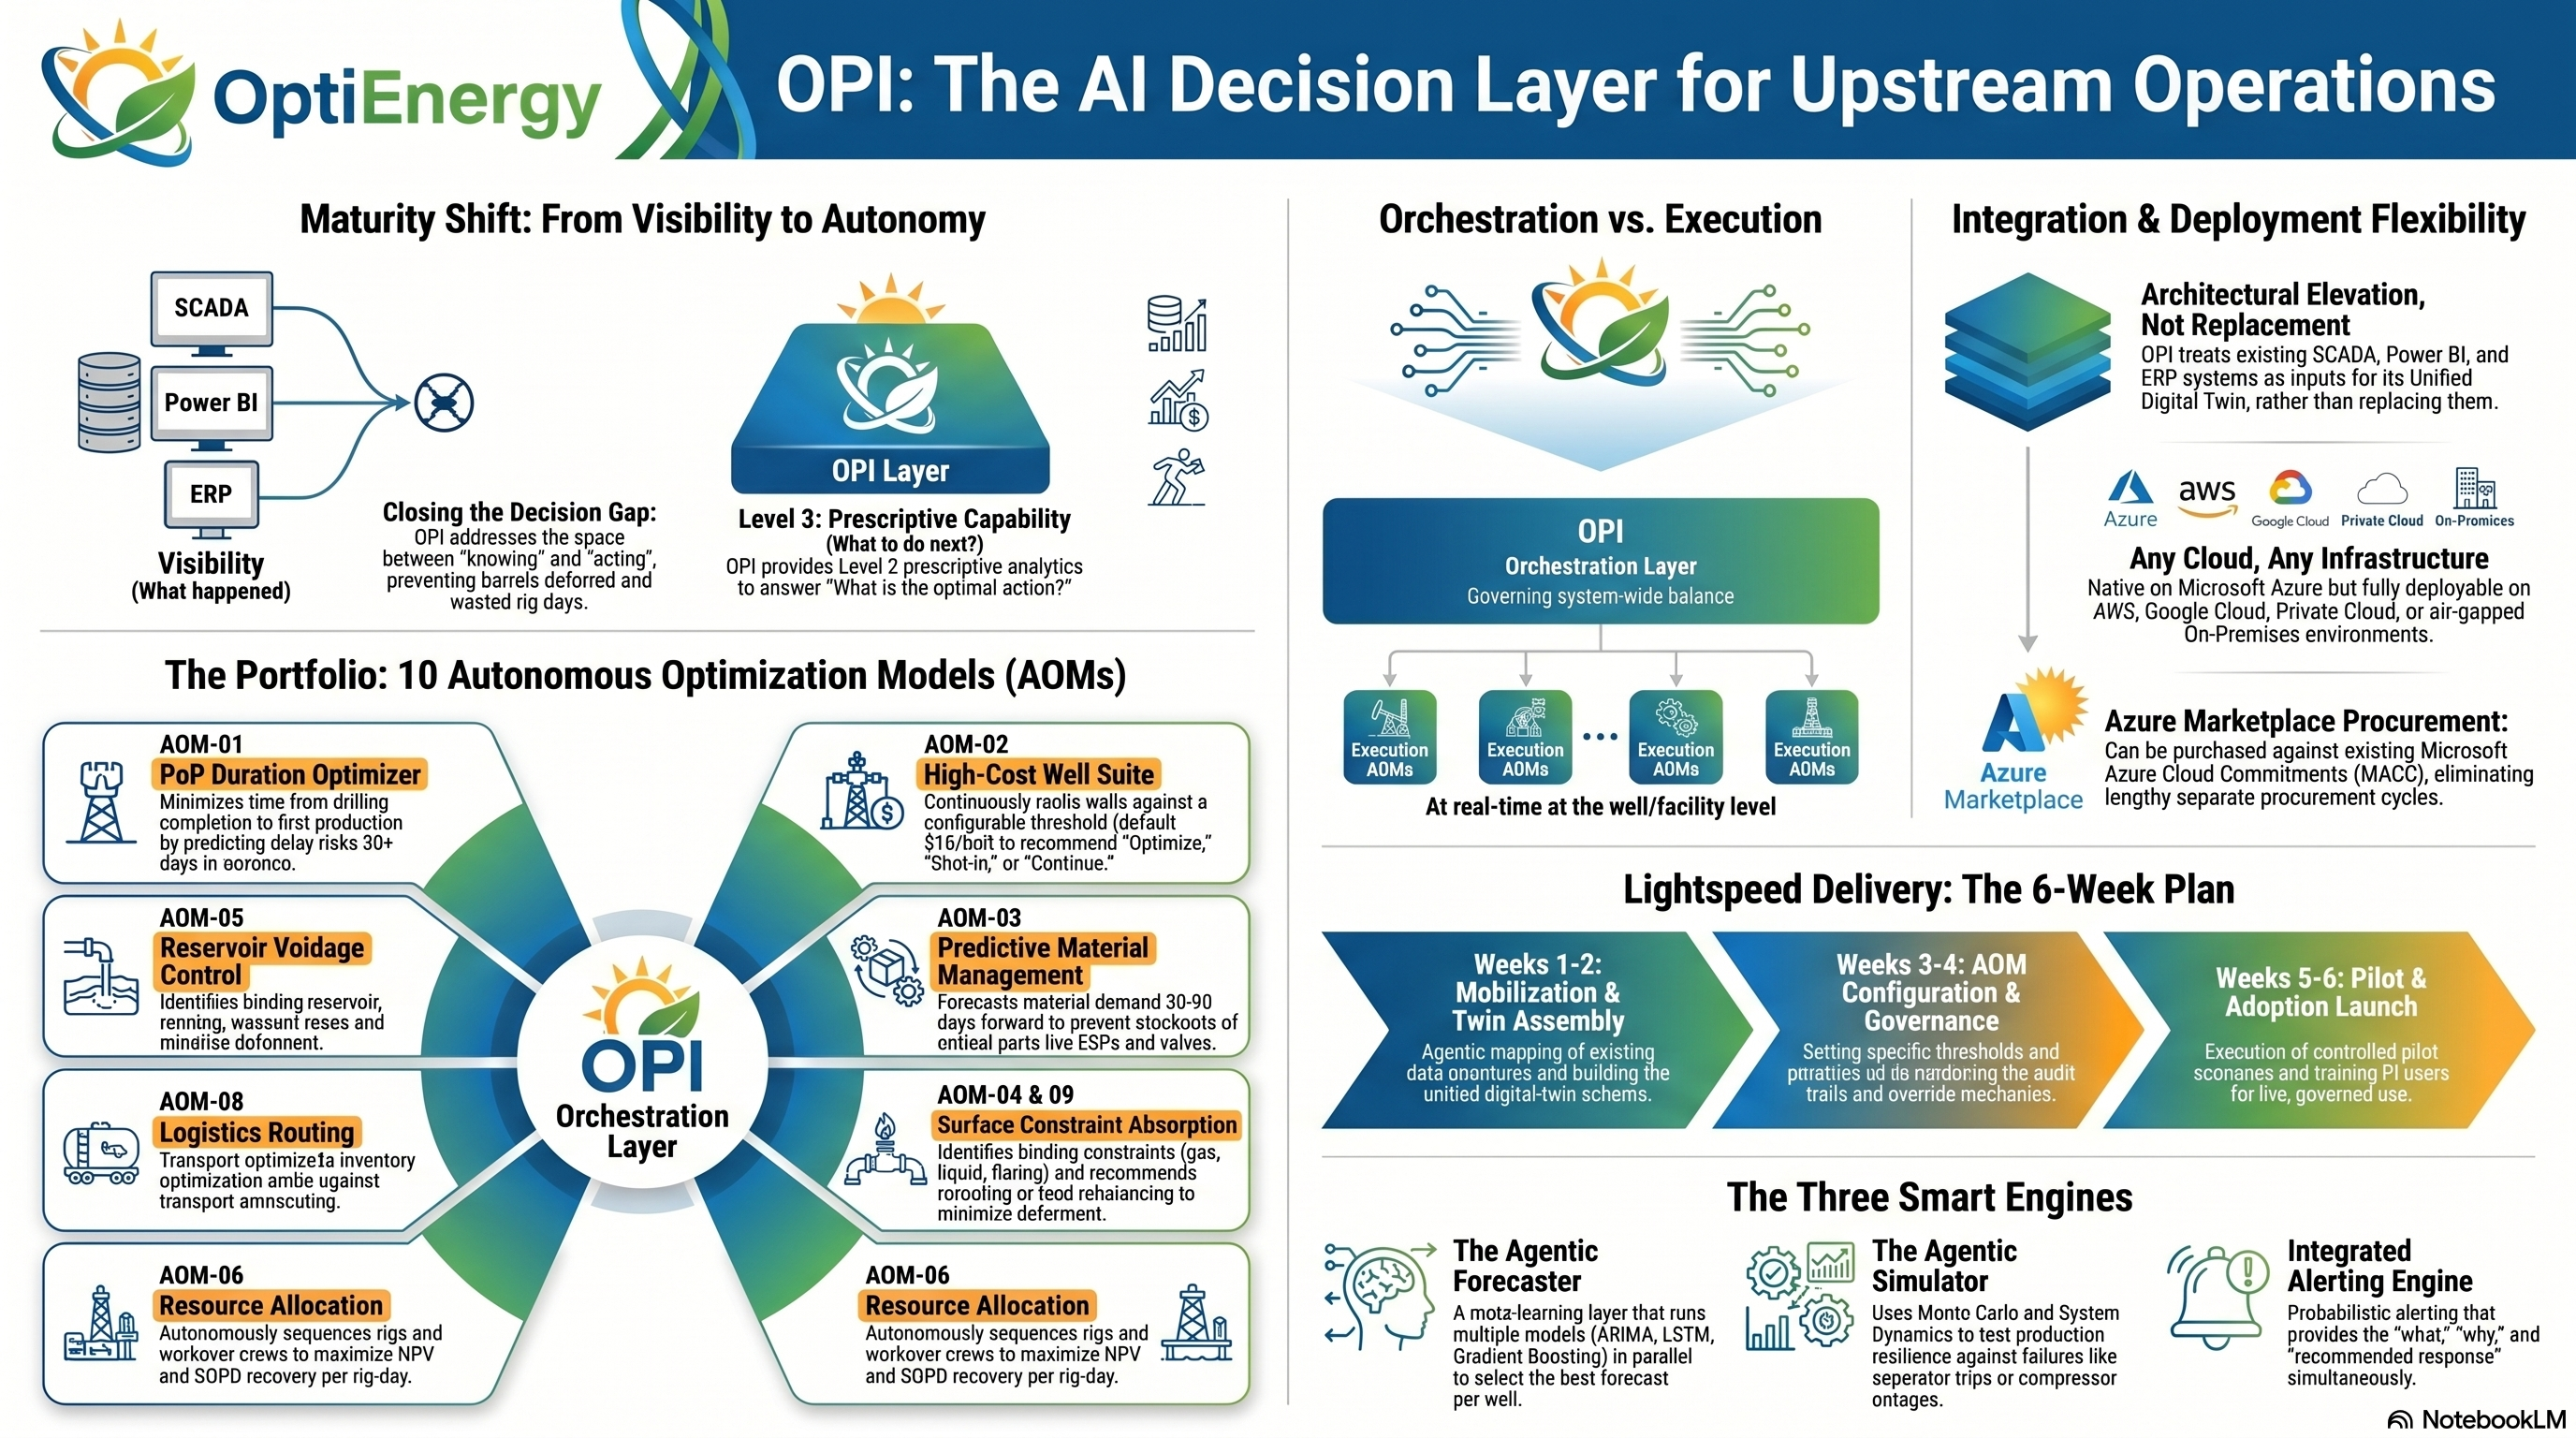
Crude selection, blending, conversion, energy, logistics, reliability — upstream wells through to refinery gate. The full roster, mapped to where each player works on the value chain.
Upstream Operations Flow
Take it with you.
Infographic is yours to download. The overview and deck go out after a quick form.
Run a energyoptimizer, or tell Opti you're interested.
Looking for OptiU thesis content? Visit the parent site.
Start with a Diagnostic.
1–2 weeks. Top-10 AOM candidates. 12-month ROI roadmap. $10K–$50K.