
The optimization backbone for healthcare operations.
From boarding to bed assignment to denial appeals, AOMs decide the optimal next move across acute, ambulatory, and revenue-cycle operations — fully explainable, fully overridable.
- Boarding −30–50%
- OR utilization +10–20%
- Denials −30–50%
- LWBS −20–40%
What it solves, who it empowers, what it delivers.
The OptiCare Team exists for one reason: to take a stack of decisions that are too fast, too constrained, and too consequential for spreadsheets — and run them in a closed loop, every cadence, against your real numbers.
- CMO / CNOClinical AND operational throughput in one trustworthy view.
- Chief Operating OfficerRuns the hospital like a system, not a stack of departments.
- ED Medical DirectorLower LWBS without burning the front-line team.
- OR DirectorFills the schedule AND protects on-time starts.
- Revenue Cycle VPCloses denials before they age out.
- Patients leave the ED without being seen — every one a clinical AND financial loss.
- OR slots go underused while elective backlogs grow.
- Beds either sit empty or board patients in hallways — never the right balance.
- Denials and underpayments leak cash silently every month.
- Staffing is set on rosters — not on what each shift actually needs.
63 players. One sector team.
Access, ED flow, inpatient throughput, periop, discharge, staffing, pharmacy, revenue cycle — every step of care. The full roster, mapped to where each player works on the value chain.
Care Continuum + Revenue Cycle
Access & Scheduling
Patient access, referral routing, and slot-fill optimizers.
Maximizes fill across providers under acuity and constraint rules.
Routes referrals to the best-fit provider/location balancing access and outcomes.
Predicts no-show risk and triggers right-sized overbooking.
Adjusts visit lengths to true case complexity.
Re-orders the queue to keep wait variance within target bands.
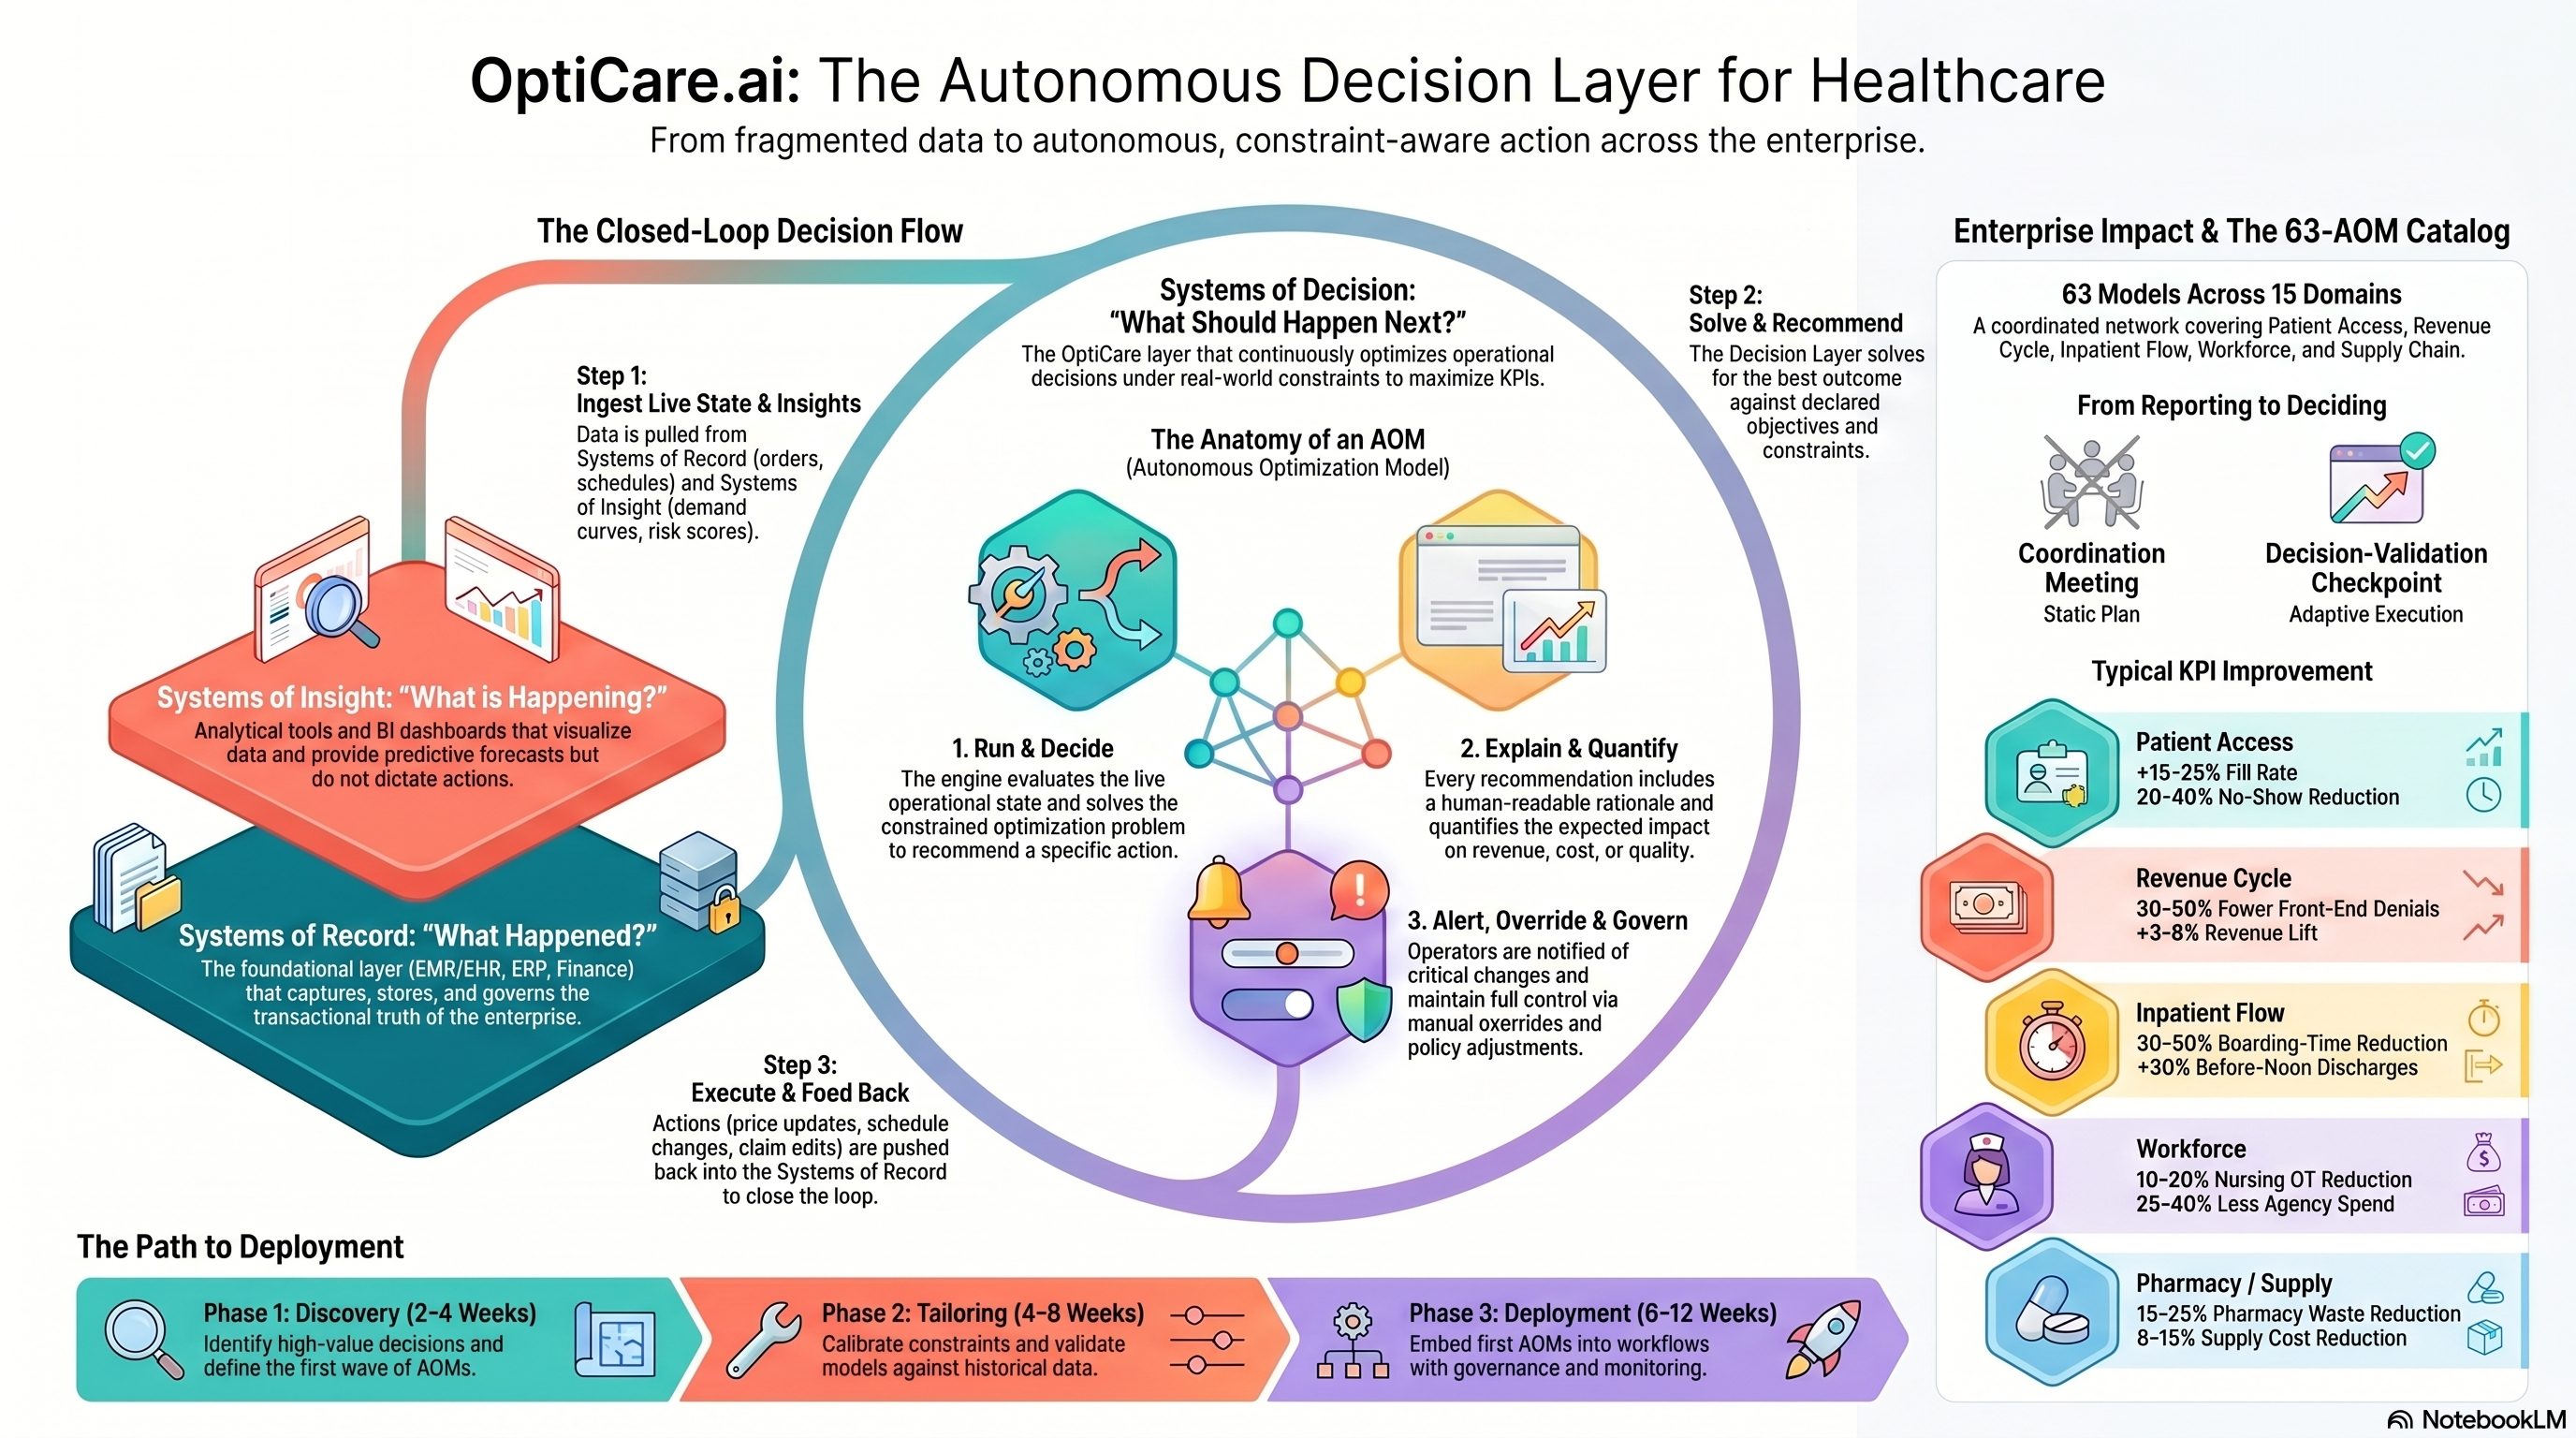
Take it with you.
Infographic is yours to download. The overview and deck go out after a quick form.
Run a careoptimizer, or tell Opti you're interested.
Looking for OptiU thesis content? Visit the parent site.
Start with a Diagnostic.
1–2 weeks. Top-10 AOM candidates. 12-month ROI roadmap. $10K–$50K.